|
LITUANUS
LITHUANIAN QUARTERLY JOURNAL OF ARTS AND SCIENCES
Volume 29, No.1 - Spring 1983
Editor of this issue: Antanas Klimas
ISSN 0024-5089
Copyright © 1983 LITUANUS Foundation, Inc.
|

|
IMMIGRANT POPULATION PATTERNS OF FINNS, ESTONIANS, LATVIANS, AND LITHUANIANS IN THE U.S. FEDERAL CENSUS OF 1930
WILLIAM WOLKOVICH-VALKAVIČIUS
The north central corridor of Europe is peopled by the relatively little-known Finns, Estonians, Latvians, and Lithuanians. They are either passed over in silence or barely mentioned in standard volumes on immigration, such as the studies of Louis Adamic or Maldwyn Jones. The fault lies chiefly if not entirely in the ethnics themselves. They have scarcely produced a body of literature in English to preserve, for the general public, something of their distinct New World experience. Only the Finns have of late started to meet the challenge of addressing this gap in U.S. history. (See bibliography.)
Geographically adjacent to one another and rather moderate in size, the four groups of Finns and Baits display notable parallels in their past. First of all, each land was at one time subject to the influence of a culturally and militarily superior neighbor, such as Sweden, Germany, or Poland. Secondly, all four stocks eventually were wrested from the dominance of these neighbors by powerful tsarist Russia. What's more, in the aftermath of World War I each ethnic community proclaimed its independence within a
year of one another. Still another likeness common to these nationalities was their basic agrarian economy, which surrendered thousands of peasants to the shores of the New World.
Alongside these kinships among Finns, Estonians, Latvians, and Lithuanians there were major differences. Lithuanians were principally Roman Catholic. Finns were nearly all Lutheran. Although Latvians and Estonians were chiefly Lutheran, there were, respectively, sizeable minorities of Roman Catholics and Eastern Orthodox. Besides religious dissimilarities language separated the four groups. Lithuanians and Latvians shared speech of common roots, though they did not necessarily understand each other with ease. Estonians and Finns, also speaking a language derived from a common font, were able to communicate with some facility. Furthermore, German was widely used by Estonians and Latvians as a second tongue, while large numbers of Lithuanians spoke at least limited Polish. Swedish was the first language of a notable Finnish minority. But not only religion and speech divided these groups.
Since the dominant motive of emigration was generally economic survival, several more differences must be recorded. Estonians and Latvians enjoyed their large seaports of Tallinn and Riga. Finns relied on Helsinki, though the long icing season from January to May limited commerce. Lithuanians, however, had no major port, but only fishing and resort villages, such as Palanga. Only after the Lithuanians seized
Memel (Klaipėda) h 1923 was the first maritime academy established. Thus while the emigres were mostly farmers, with some artisans in their midst, there was also a not insignificant segment of Finns and a large minority of Estonians and Latvians of seafaring background.
Serfdom was another major element. For Lithuanians the tsar abolished the practice only as late as 1861, whereas their three neighbors achieved greater liberty early in the nineteenth century under a modified system, partly resulting from more lenient policies of Alexander I. His liberal attitude contributed to earlier industrialization in Estonia, Latvia, and Finland than it did in Lithuania. At the dawn of the twentieth century in Finland there was, for
example, a notable changeover from a rural society to an industrial economy because of marked expansion of the lumber business.
Another factor worthy of examination is education. Tsarist restrictions on learning were most severe in the province of Lithuania. There, except for some home teaching by a parent or neighbor or a secretly-conducted church-sponsored "school," peasants had little access to education. The prime Russification weapon was the unusual press ban on the use of the Latin alphabet from 1864 to 1904. This ukase considerably impeded literacy endeavors among Lithuanians. Estonians and Latvians, in contrast to Lithuanians, fared better because of earlier favorable Swedish and German influences. Finns, too, profited from positive Swedish rule in regard to education. When Lithuania recovered its independence, Finnish educators were consulted about their methods for possible adoption. Later, under the tsar, Finns had a good deal of autonomy and, from as far back as the 1860s, established increasing numbers of four- and six-year grammar schools.
The likenesses of Finns and Baits in their home environment evidently played no discernible role in their transplanted life across the Atlantic. Their divergencies did have a bearing on their endeavors to inherit a portion of the American dream. The influence of these differences will emerge as this paper explores the demographic patterns of Finns and Baits in their adopted homeland.
The 1930 federal census is the frame of reference for this inquiry. Its suitability rests on several factors. By that year each homeland had become independent. Thus the probability was good that respondents would give their ethnographic birthplace in reply to the query on "country of origin."1 Furthermore, by 1930 the immigration restriction
laws of 1924 had begun to take their toll by reducing substantially the flow of newcomers from Finnish and Baltic households. It seems, however, that this reduced influx of immigrants during the 1930s did not dramatically alter the demographic patterns already fixed by 1930. Granted, one must allow for some job-changing and its related mobility in the earlier years of an immigrant's stay in America. Nevertheless, my research strongly suggests that by the start of the fourth decade of this century almost all the Finns and Baits were already locked into their economic position and permanently attached to their place of residence.
Before inspecting the federal data of 1930 one must first question the reliability of that data. Professor
Tönu Parming, for example, has uncovered figures for Estonians ranging from 69,000 to 200,000, whereas the governmental tally shows a mere 3,500 foreign-born Estonians. Estimates for Lithuanians range up to a half million, while their count is recorded in the census as 193,606. Spokesmen for each ethnic group, such as consuls and leaders of national fraternal alliances, charging gross error in federal documents, have insisted that there were substantially higher numbers of their ethnic peers.
Moving on from the "country of origin" category with its potentially inherent confusion, one comes to "mother tongue," another pertinent listing. As defined by the census, this expression refers to the language spoken in the home. Statistics for this category nevertheless are puzzlingly low also. Perhaps respondents were ashamed to admit using a language other than English. More research is required before a satisfactory explanation can be arrived at.
There is evidence that census takers sometimes avoided entire neighborhoods of the foreign-born because of the language barrier. What's more, there is the well-known phenomenon of the landlady who rented rooms to three shifts of laborers within a single day. If the census taker succeeded in overcoming the
speech obstacle, still one wonders how patiently and fruitfully the entire roster of boarders may have been noted. For this paper it seems safe to assume that the inefficiencies of the counting system were evenly spread among the Finns and Balts. Though the
1930 count was surely less than it ought to have been, I do not believe it substantially distorted the patterns and proportions of population. Thus the census figures are at least tentatively workable to achieve the goals of this study.
TABLE 1
|
IMMIGRANTS IN U. S
|
HOMELAND
|
|
1930 1920
|
Lithuanians
193,606 135,068
Finns
142,478 149,824
Latvians
20,673
*
Estonians
3,550
*
|
1923 — 3,316,000
1930 — 3,463,000
1935 — 1,950,502
1934 — 1,126,413
|
Total Baits & Finns = 360,307 or 2.69% of all-immigrant total of 13,366,407 (Source: U. S. Department of Commerce, Bureau of Census, Fifteenth Census of the United States: 1930, Vol. II, U. S. Government Printing Office, Washington, D. C., 1933, p. 225. Hereafter — Census, 1930)
* Included with Russia.
To begin, it is helpful to set down homeland population totals, as found in standard reference works, for the available years nearest to 1930, to allow comparison of numbers and percentages of Finns and Baits in the United States. Table 1 provides this starting point. What strikes us is the rather high proportion of Lithuanians who left their birthplace, i.e. nearly 6 percent. In fact, David Fainhauz asserts that Lithuanians, second only to the Irish, suffered the most severe drain of people among all immigrants.2 Finns, with their 4.11 percent emigration, were also rather high. Although the vast majority of Lithuanians departed for the United States, some went to England and Scotland. Among Finns a large contingent took up residence in Russia, especially in the Karelia region; presumably some of them eventually found their way to the New World. It is difficult to comment on Latvians and Estonians in this regard since there is so little readily available
information.
TABLE 2
Because the United States offered de jure recognition to the Baltic states only in July 1922, their nationals were not given a separate rubric in the census count of 1920. Lithuanians were an exception. Their avid spokesmen had earlier persuaded immigration officials to begin listing Lithuanians as far back as 1899, so that by 1910, even though still politically under Russia, they were included as a separate category in the decennial census.
If the drop among Finnish immigrants to America in the intervening decade of 1920-1930 is at all accurate, it may be attributed to two causes: better homeland conditions and disillusionment with labor conditions in the United States. Moreover, a sizeable segment of Finns returned home after having pocketed a degree of wealth. Estimates of Finnish repatriates vary from one-fifth to one-third of the total emigrants. Regarding Lithuanians, one notes that the lure of the New World remained strong, even during the first years of restored independence. A succession of presidential regimes under Smetona, Stulginskis, Grinius, and again Smetona did not prove sufficiently enticing to stem the departures.
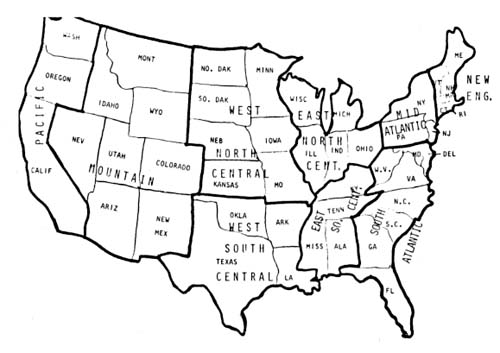
Turning to the census tracts, one may begin by observing Baits and Finns in various parts of the country. "Division," as used in the 1930 census, refers to a grouping of states into nine regions. See Table 2. Density within these divisions differed for the four ethnic groups. Lithuanians settled mostly in New England, the Middle Atlantic, and East North Central regions. The rest of the Lithuanians were scattered. Finns were found in the same divisions, with concentrations in the West North Central and Pacific regions, but they were spread out even more. Somewhat in contrast, Latvians resided chiefly in the Middle Atlantic region, and in the other east coast divisions. Estonians were the most dispersed of all, the bulk of them residing in the Middle Atlantic region. See Table 3 for a listing of the five leading divisions for each ethnic group.
Other perceptions stemming form the percentages of distribution within divisions relative to the total foreign-born population are as follows: Finns accounted for 2.4 percent of newcomers in the West North Central region, and Lithuanians represented 2.3 percent in New England. The highest Latvian figure was 0.4 percent in the South Atlantic region. Estonians fell among the
uncrated in the class of fewer than 0.1 percent. The density of Finns and Lithuanians in their best divisions will become clearer through an inspection of state populations.
Considering total immigrants in a given state, of the four ethnic groups in this study, we see that the Finns, who reached 6.2 percent in Minnesota, scored highest.
Lithuanians comprised 3.6 percent in both Illinois and Maryland. Somewhat surprisingly, Latvians accounted for 1.1 percent of the immigrants in Virginia, 0.9 percent in South Carolina, and 0.8 percent in Georgia. Once more, Estonians were untallied in all but five states, where they constituted 0.1 percent. Table 4 indicates leading percentages for Finns and Baits. The proportion of Estonians and Latvians in southern states attests not so much to their numerical strength as it does to the lack of variety of immigrants, few of whom were drawn to the hot climate or to the paucity of industrial centers requiring unskilled labor.
Table 3
POPULATION DISTRIBUTION BY LEADING DIVISIONS
|
LITHUANIANS
69,882 MIDDLE ATLANTIC
67,872 EAST NO. CENTRAL
41,753 NEW ENGLAND
5,681 SO, ATLANTIC
3,837 WEST NO. CENTRAL |
FINNS
42,946 EAST NO. CENTRAL
26,328 WEST NO. CENTRAL
25,004 PACIFIC
22,290 MIDDLE ATLANTIC
18,503 NEW ENGLAND |
LATVIANS
9,052 MIDDLE ATLANTIC
4,451 EAST NO. CENTRAL
2,906 NEW ENGLAND
1,632 PACIFIC
1,384 SO. ATLANTIC |
ESTONIANS
1,949 MIDDLE ATLANTIC
692 PACIFIC
401 EAST NO, CENTRAL
182 NEW ENGLAND
119 S, ATLANTIC |
(Source: Census, 1930, p. 235)
Table 4
STATE DISTRIBUTION BY PERCENTAGE OF TOTAL FOREIGN-BORN
|
LITHUANIANS |
FINNS |
LATVIANS |
ESTONIANS |
|
3.6 % ILLINOIS
3.6 % MARYLAND
3.4 % CONN.
3.0 % PENN, |
6.2 % MINNESOTA
5.0 % OREGON
4.3 % WASHINGTON
3.6 % MICHIGAN |
1.1 % VIRGINIA
0.9 % SO. CAROLINA
0.8 % GEORGIA
0.5 % TENNESSEE |
ALL 0.1 %
ALABAMA, DELAWARE
FLORIDA, LOUISIANA
OREGON, WASHINGTON |
(Source: Census, 1930, pp. 237-39)
Settlement profiles emerge more lucidly in the gross figures shown in Table 5, which presents the leading eight states for each ethnic group. This data has a number
of implications. Lithuanians barely ventured beyond the Mississippi River. Exceptions are known along main railways leading into Sioux City, Iowa and Omaha, Nebraska. In comparison, Finns and Estonians were decentralized, taking up residence in the east,
midwest, and Pacific coast. New York and Michigan were common homes to all four ethnic stocks, while California, Illinois, Ohio, Pennsylvania, and Massachusetts are on the list for three of the four groups. To the surprise of no one, no southern state appears in this table. Except for Blacks and the Acadian French in New Orleans, the entire south has been greatly homogeneous in ethnic makeup.
Table 5
POPULATION DISTRIBUTION BY LEADING STATES
|
LITHUANIANS |
FINNS |
LATVIANS |
ESTONIANS |
|
1) ILLINOIS 44,733
2) PENNA,
37,079
3) MASS. 25,219
4) NEW YORK 22,933
5) CONN, 13,247
6) NEW JERSEY 9,870
7) MICHIGAN 9,340
8) OHIO 7,581 |
1) MICHIGAN 27,022
2) MINNESOTA
24,360
3) NEW YORK 17,444
4) MASS. 13,077
5) WASH, 11,022
6) CALIF. 8,495
7) OHIO
5,633
8) OREGON 5,507 |
1) NEW YORK 5,971
2) ILLINOIS
2,609
3) MASS. 2,315
4) CALIF, 1,189
5) PENNA, 1,187
6) OHIO
721
7) MICHIGAN 674
8) MARYLAND 624 |
1) NEW YORK 1,505
2) CALIF.
436
3) NEW JERSEY 234
4) PENNA.
210
5) WASH.
149
6) ILLINOIS 127
7) MICHIGAN 123
8) OREGON
107 |
(Source: Census, 1930, p. 235)
Beyond divisions and states, census tracts shed further light on ethnic strongholds in the category of cities with 100,000 or more inhabitants. The polyglot character of magnet cities becomes evident in places like New York, Chicago, Detroit, Cleveland, and Philadelphia. Their locations as ports of entry or as major waterways of commerce explain the drawing and holding power they had on immigrants. For the most part the earliest ethnic newspapers and mutual-benefit societies originated in these cities. Even after the new entrants had dispersed into the interior, the same huge urban areas held sway as influential cultural and educational bastions. The ten principal Metropolises for Baits and Finns are designated in Table 6.
Table 6
DISTRIBUTION IN CITIES OF 100,000 OR MORE
|
LITHUANIANS |
FINNS |
LATVIANS |
ESTONIANS |
|
1) CHICAGO 31,430
2) NEW YORK 15,005
3) PHILADEL. 6,514
1) BOSTON 5,869
5) DETROIT 4,879
6) CLEVELAND 4,698
7) WORCESTER 4,549
8) PITTSBURG 3,258
9) BALTIMORE 3,105
10) SCRANTON 2,541 |
1) NEW YORK 13,224
2)
DULUTH 3,040
3) DETROIT 2,811
1) CHICAGO 2,261
5) SAN FRAN. 2,063
6) SEATTLE 1,950
7) WORCESTER 1,698
8) PORTLAND, 0. 1,396
9) MINNEAPOL1S 1,154
10) LOS ANGELES 1,011 |
1) NEW YORK 5,172
2) CHICAGO 2,260
3) BOSTON 1,050
1) PHILADEL. 1,030
5) BALTIMORE 585
6) LOS ANGELES 452
7) DETROIT
399
8) CLEVELAND 371
9) SAN FRAN. 320
10) MILWAUKEE 194 |
1) NEW YORK 1,340
2) SAN FRAN, 195
3) PHILADEL. 149
1) CHICAGO 109
5) DETROIT
83
6) LOS ANGELES 83
7) CLEVELAND 53
8) BOSTON
45
9) SEATTLE
37
10) BALTIMORE 31 |
(Source: Census, 1930, p. 249)
Nevertheless, one must not assume that the largest colonies of these four ethnic stocks were fully reflected within the aforementioned urban statistics. Often cities of fewer than 100,000 people were heavily populated by immigrants. For instance, outside New York City the biggest Finnish settlement was in Fitchburg, Massachusetts (total pop. in 1930 — 40,692), where as early as 1905, there were 3,000 Finns, increasing to 5,000 by 1910. Another Finnish enclave was Maynard, Massachusetts (estimated 1930 population — 5,000), which was important enough to host the annual Suomi Synod national convention in 1926. The town of Hancock, Michigan (1940 population — 5,554) has been predominantly Finnish and houses the only institution of higher learning, the Suomi College and Theological Seminary, founded in 1896. Other notable Finnish locales included small municipalities such as Ashtabula, Ohio and Astoria, Oregon. Lithuanians were quite numerous in Waterbury and New Britain, Connecticut; Brockton and Lawrence, Massachusetts; Elizabeth and Paterson, New Jersey; and especially in Shenandoah, Pennsylvania. Estonians were identifiable in Marquette County, Michigan at small towns like Ishpeming, Marquette, Negaunee, and Republic; in Minnesota at Eveleth, Ely, and
Hibbing; in Illinois at DeKalb and Waukegan.
In historical perspective one discovers that first settlements did not necessarily forecast dense colonization in the future. After the Civil War when Lithuanians first began coming in noticeable waves, they lodged in Pennsylvanian hamlets such as Forest City, Freeland, Hazelton, Mahanoy City, Mount Carmel, Pittston, Plymouth, Shamokin, Tamaqua, and Wilkes-Barre. While large numbers remained in these
coal towns, by 1930 (and even earlier) the center of culture had shifted to the greater Chicago area, which to this day it has remained.
The first Latvian foothold was in the late 1880s in Boston, where a tiny colony remains to this present time, but by 1930 these immigrants clustered in New York City and Chicago. Estonians revere the environs of Fort Pierre, South Dakota, which in 1894 was their first documented settlement (though there is evidence of earlier newcomers); Chester,
Montana is also one of the earliest known Estonian enclaves. Soon others followed, located in San Francisco and neighboring west coast cities. But like their Latvian neighbors, Estonians by 1930 were huddled mostly in the metropolitan region of New York City.
Finns alone among the four ethnic groups perpetuated colonies where they first began residing. Lured by the copper mine-owners of Michigan, Finns struck out in the New World as recruits from mining areas of Norway in the 1860s. Iron mines in Michigan (and a few decades later in Wisconsin) assured a measure of permanence to these Finnish communities. Meanwhile, as numerous Finns peopled Minnesota and Michigan by 1930, lively clusters thrived in isolated cities and towns elsewhere, such as Fitchburg, Maynard, and Worcester, Massachusetts.
Further insights into the distribution patterns develop from an examination of the census headings "urban," "Rural-non-farm," and "rural farm." In the 1930 count, rural meant a town of 2,500 or fewer people. Thus Balts and Finns divided as is shown in Table 7-A. This data shows that nearly as many farming Finns lived in small towns as they did in larger jurisdictions, that is, almost 44 percent. Significantly too, more than 78 percent lived outside urban centers. Finnish historian John Wargelin relates that in the spring of 1922 about 100 Finnish farmers marketed 100,000 quarts of strawberries from their patches in Worcester (Mass.) County. He points out that in 1923 90 percent of the farms of St. Louis County in Minnesota were owned by Finns. Unlike the other groups under consideration, Finns took kindly to the soil in large numbers.
When a Lithuanian in Pennsylvania or Spring Valley, Illinois or Thomas, West Virginia left the coalmines because
of personal dissatisfaction or because he had been laid off, poverty blocked any dream of his buying a farm — although few were attracted to such a goal. The case of the Finns was a matter of being in the right place at the right time. Those who chose, for whatever reason, to abandon mining were still able to purchase farmland in the same vicinity for a modest price. Many took this route.
Table 7-A
| |
URBAN |
RURAL NON-FARM |
RURAL FARM |
TOTAL RURAL PERCENTAGE |
|
LITHUANIANS |
168,090 |
17,752 |
7,764 |
13.17 % |
| FINNS |
79,867 |
26,894 |
35,717 |
43.94 % |
| LATVIANS |
18,744 |
1,257 |
672 |
9.33 % |
| ESTONIANS |
2,982 |
336 |
232 |
16.00 % |
(Source: Census, 1930, p. 232)
Almost all Finns were equipped with at least minimal literacy, an asset the Lithuanians did not share in such generous proportion. At the turn of the century when literacy among all arrivals was up to 74 percent, Finns were far superior. As one authority put it:
When immigrants arrived from Finland, American officials reported that most of the newcomers could read and write. Between July 1899 and June 1910, under two percent of the new arrivals fourteen years old and older, could neither read nor write.3
With 48 percent unable to read or write, Lithuanians entering the United States were crippled by a pathetic literacy rate. The overall figure for illiteracy among immigrants was 26 percent.
Literacy implied some measure of education that, in turn, often led to acquisition of citizenship, a new status that tended to accelerate assimilation. A look at percentages of the enfranchised Baits and Finns provides a clue to their distribution. Relevant gross figures and percentages illumine this question. See Table 7-B. First place was held by Latvians and reflects their advanced rate of literacy in the homeland. But perhaps more important this first rank suggests that members of the educated class, compared to the other Baits and Finns, were a larger proportion of the pre-1930 immigrants. In view of favorable homeland educational opportunities, the Estonian percentage is rather low. Evidently the Estonian migration drew a larger portion of unskilled workers. The Lithuanian percentage is somewhat unusual considering their poor schooling climate. It is true
that every Lithuanian colony here had a citizens' club to promote naturalization. Another factor was the Americanization program of the 1920s in cities and towns across the nation. Perhaps some of the more zealous leaders, especially clergy, were persuasive in fostering pursuit of citizenship. Yet these elements were not exclusive characteristics of Lithuanians. A satisfactory explanation remains elusive.
Table 7-B
CITIZENSHIP
|
LATVIANS |
12,500 OF
20,673 OR 60.9% |
|
FINNS |
72,709 OF 142,478 OR
51.0 |
|
LITHUANIANS |
91,875 OF 193,606 OR
47.5% |
|
ESTONIANS |
1,501 OF
3,550 OR 42.3% |
(Source: Census, 1930, p. 406)
A final census category of relevance is the breakdown of citizens into urban, rural non-farm, and rural farm classifications, as indicated in Table 7-C. A priori, one might surmise that chances to learn and to obtain citizenship were the best in the city, less favorable in rural non-farm sections, and least available in strictly farm areas. This proved true among Latvians and Lithuanians for whom there is a descending gradation. The precise opposite held true for Finns and Estonians for whom there are leaps in about the same proportions. Speculatively, it seems that unskilled Finns and Estonians were more likely to settle in cities, whereas the
better educated among them found haven in the countryside as farm owners and not just as hired hands.4
Table 7-C
CITIZENSHIP BY AREAS
|
|
URBAN |
RURAL NON-FARM |
RURAL FARM |
|
LATVIANS |
61.3 % |
58.0 % |
53.9 % |
|
FINNS |
46.9 % |
49.0 % |
61.8 % |
|
LITHUANIANS |
48.3 % |
42.9 % |
40.0 % |
|
ESTONIANS |
41.5 % |
43.2 % |
50.4 % |
(Source: Census, 1930, p. 411)
Population scores for rural-farm residents sharply separate Baits from Finns. For Estonians 6.5 percent lived on farms, 4 percent of Lithuanians did so as well, while only 3.25 percent of Latvians dwelt in the country. However, a significant 25 percent of Finns inhabited farmlands. A few Lithuanians did find work on tobacco plantations of the Connecticut Valley and in dairies and on produce farms in upper New England and in a few isolated colonies such as Custer, Michigan. Lithuanians, on the other hand, were more likely to be wage earners as tailors in Boston and Baltimore; as textile hands in Manchester, New Hampshire or Lawrence, Massachusetts; as
shoe workers in Brockton, Massachusetts or Lewiston, Maine; as carpet makers in Amsterdam, New York; as wire workers in Worcester, Massachusetts; as
furniture makers in Gardner, Massachusetts; as silk employees in Paterson, New Jersey; as
meat men in Chicago slaughterhouses;5 and as miners throughout the anthracite region of the Scranton and Wilkes-Barre territory of Pennsylvania.
Estonians farmed at places like Irma and Gleason, Wisconsin; Dundee and Rose Lodge, Oregon; Moorcroft, Wyoming; and Snohomish, Washington. They grew plums, peaches, pears, and apples in Aberdeen and Seattle, Washington; cut logs in the sawmills of Eureka and Fort Bragg, California; cultivated grapes at Reedley in that same state; and cut granite in the quarries of Quincy, Massachusetts.
The very low figure of 3.25 percent for Latvians in rural colonies shows that they were the least inclined of the four ethnic groups to earn their livelihood on the soil. Instead, they flocked almost exclusively to urban shelters. Only tiny communities of rural Latvians can be traced to the vicinity of
Easton, Pennsylvania; the neighborhoods of Amsterdam and Albany, New York; and scattered around Wisconsin. The Latvian migration consisted more of semi-skilled and professional newcomers. Highly individualistic in temperament, Latvians frequently engaged in music, art, and literature. By the 1930s they did not have single national organization, so swift was their assimilation and so dispersed were they. The scarcity of writings on their immigrant experience is a telling sign of their absorption into mainstream America.
Finns seemed to move about more aggressively, traveling from the east far inland to the midwest or coming down through Canada or Alaska into the Pacific coastlands. The milieu and landscape of the northern states, which was reminiscent of the native land, provided a welcome backdrop for their daily toil. They circulated among the copper mines of Michigan and the iron works of Wisconsin. Some entered farming directly on arrival, while others transferred jobs from the mines. In the vicinity of Hancock, Michigan they left their ethnic imprint on places such as Nisula, Tapiola, and Toivola. They bought up abandoned farms around Duluth, Minnesota, while some took up lumbering in the uncleared forests of the northern midwest. In rural settings they went beyond dairying and ventured into growing such specialties as fruits, cranberries, and blueberries.6 Others enterprised in cattle and poultry raising. An increasing literature on Finns is now unfolding the narrative of their agrarian settlements, especially those in the midwest. (See the titles in the bibliography.)
Expectedly, some Finns and Estonians earned their daily bread as dockhands and fishermen, though Latvians are conspicuously absent from these trades. Some Finns and Estonians, not a few of whom jumped ship to escape Russian authorities, settled as maritime workers to fish salmon on the Columbia River or to labor as loaders in the giant ports of San Francisco, Los Angeles, and the Great Lakes. The saga of these seamen beckons historians and poets to describe
such adventurous escapades such as jumping ship and entering the United States with forged passports.
Summary
With most immigrants, the chief or sole reason for uprooting was economic survival. The same factor was a powerful determinant of the newcomer's place of residence and livelihood and created the patterns of distribution described in this paper. The immigrant went wherever he heard about a job; he traveled wherever his friends or relatives told him about work; he changed employment once or twice in his lifetime, hoping for a modest portion of the American dream. Many Baits and Finns had only their unskilled but strong muscles to offer the expanding industrial economy, so they attached themselves to mines and factories. Only a large minority of Finns found it feasible to take up farming. Homeland literacy had a bearing on the immigrants' demographic profile, as did their previous maritime experience. There appears to be no geographical proximity by design among Finns and Baits. Entering as individual immigrants, their coming was far different from the wholesale transfers of large families, such as the Russian Jews or the early pietistic German communities, from other parts of Europe. Common history seemed to have no role in the settlements of Baits and Finns, nor did their marked differences prevent them from coming together in the mills and shops where their untrained hands were the common bond.
In this short inquiry it was not possible to say a great deal about Estonians and Latvians. As my bibliography shows, Finns are far ahead of their Baltic neighbors in researching the U.S. immigrant experience. The migration studies movement in Finland began in the 1960s, reaching a milestone in 1974 in the establishment of the Institute for Migration at the University of Turku. The sterling example of the Finns is a welcome goal to Estonians, Latvians, and Lithuanians. In closing, let us all hope for much more research into the fascinating narrative of the far-flung immigrant experience that is so much a part of the fabric of American history.
SELECT BIBLIOGRAPHY
GENERAL REFERENCE WORKS
Brief popular descriptions of Baits and Finns are found in the following sources:
Konrad Bercovici, On New Shores (New York, 1925)
Roucek & Brown, Our Racial and National Minorities (New York,
1937)
—— One America (Englewood Cliffs, N.J., 1972) revised and
renamed version of above volume.
Makers of America, many eds., 10 vols. (Encyclopedia Brittanica,
1971)
PERIODICAL LITERATURE
Lituanus and the Journal of Baltic Studies occasionally carry articles on the immigrant experience in the U.S.A.
ESTONIANS
Pennar, Parming & Rebane, The Estonians in America, 1627-1975 (Dobbs Ferry, N. Y., 1975)
Tonu Parming, "American Ethnic Statistics: An Evaluation Based on Estonian Immigration to the United States", paper presented at Fifth Conference on Baltic Studies in Scandinavia — Stockholm, Sweden, June 14-17, 1979.
LATVIANS
Karklis, Streips & Streips, The Latvians in America, 1640-1973 (Dobbs Ferry, N. Y., 1974)
LITHUANIANS
Antanas Kučas, Lithuanians in America (Boston, 1975)
Algirdas Bureckis, The Lithuanians in America, 7657-7975 (Dobbs
Ferry, N. Y., 1976)
Fainhauz & Kezys, Lithuanians in Multi-Ethnic Chicago (Chicago,
1977)
John Cadzow, Lithuanian Americans and Their Communities of Cleveland
(Cleveland, 1978)
William Wolkovich-Valkavičius, "Lithuanian Catholics in America",
in Robert Trisco, ed., Catholics in America (Washington, D.C.,
1976)
—— "Lithuanian Immigrants and Their Irish Bishops in the Catholic Church of Connecticut" ir Dyrud, Novak & Vecoli, eds., The Other Catholics (New York, 1978)
—— Lithuanian Pioneer Priest of New England: The Life, Struggles, and Tragic Death of Rev. Joseph Žebris, 1860-1915 (Brooklyn, N.Y., 1980)
FINNS
John Wargelin, The Americanization of the Finns (Hancock,
Michigan, 1924; reprinted, San Francisco, 1972)
H. H. Turner, Case Studies of Consumer Cooperatives . . . Finnish Croups in the United States
(New York, 1941)
A. W. Hoglund, Finnish Immigrants in America, 1880-1920
(Madison, Wisconsin, 1960)
J. I. Kolehmainen, The Finns in America: A Student's Guide to Localized History
(New York, 1968)
R. J. Jalkanen, ed., The Finns in North America: A Social
Symposium
(Hancock, 1969)
—— ed., The Faith of the Finns (E. Lansing, Michigan, 1972)
Reino Kero, Finnish Americans: Migration from Finland to North America in the Years Between the Civil War and World War I (Turku, Finland, 1974)
Karni, Kaups, Ollila, Jr., eds., The Finnish Experience in the Western Great Lakes Region: New Perspectives (Turku, 1975)
Erik Friis, The Scandinavian Presence (New York, 1976)
Vilho Niitemaa et al, eds., Old Friends — Strong Ties: Finland Salutes the United States of America (Vaasa, Finland, 1976)
The Finns in America and Finland: A Bibliography of the Writings of John I. Kolehmainen, 2nd ed., (Tiffin, Ohio, 1980)
Reino Nikolai Hannula, Blueberry God: The Education of Finnish-American (San Luis Obispo, 1981)
Literature by states and counties
"Immigrant Life in the Ore Region of Northern Minnesota", The Survey 28, 1912
"Finns in the Copper Country of Michigan", World's Work 26,1913
Clemens Niemi, Americanization of the Finish People in Houghton County, Michigan (Duluth, Minnesota, 1921)
Elina Heikken, "Pioneer Finnish Settlement in Michigan", Michigan Historical Magazine 14, 1930
D. H. Davies, "The Finland Community: Minnesota", Georgia Review 25 July 1935
Federal Writers Project, The Swedes and Finns in New Jersey
(Bayonne, N. J., 1938)
J. I. Kolehmainen, "Founding of the Finnish Settlements in Ohio",
Ohio Archeological & Historical Quarterly 49, 1940
(author?) History of the Finnish Settlements in Brown and Dickey Counties of South and North
Dakote,
7887-7955 (New York
Mills, Minnesota, 1955)
A. W. Hoglund, "Finnish Immigrant Farmers in New York, 1910-
1960," O. F. Ander, ed., In the Trek of Immigrants: Essays Presented to Carl Wittke
(Rock Island, Illinois, 1964)
H. R. Wasastjernia, ed., History of the Finns in Minnesota
(Minneapolis, 1967)
Jerry P. Schofer, Urban and Rural Finnish Communities in California:
7860-7960 (San Francisco, 1975)
J. I. Kolehmainen & G. W. Hill, Haven in the Woods: The Story of the Finns in Wisconsin
(Madison, 1951; reprint — New York,
1979)
J. R. Birchert, A Quarter Century of Change in the Finland
Community of Northeastern Minnesota
(Minneapolis, ?)
[Waino E. Kontlo], History of Rolla, North Dakota Finnish Settlement: Towner County and Surrounding Area
(date?)
Literature by cities and towns
Eugene Van Cleef, "The Finns on Cape Cod," New England
Quarterly
6, 1933
Konrad Bercovici, "The Finns of Embarrass. Minnesota," On New
Shores (New York. 1925)
H. C. Babosn, Finns in Lanesville, Massachusetts (Los Angeles. 1919)
J. J. Jamison. "Finnish Settlement." This Ontonagon Country: The
Story of an American Grontier (Ontonogon. Michigan, 1939)
1 Sociologist Tönu Parming nevertheless suggests that some, born under tsarist rule, may still have given Russia as their place of nativity; this despite the respondents' homeland having been politically independent at the time of census. He also raises the complex issue of arrival in the United States by way of a third country such as Canada or Russia Proper. Parming speculates on how this experience might affect a respondent's answer.
2 David Fainhauz, Lithuanians in Multi-Ethnic Chicago (Chicago, 1977), p. 3.
3 A. W. Hoglund, Finnish Immigrants in America, 1880-1920 (Madison, Wisc., 1960), p. 20.
4 K. V. Račkauskas, Amerika, arba rinkinys įvairių faktų (New York, 1915), pp. 127-28.
5 One recalls that Jurgis [George] Rudkus is the fictional Lithuanian hero of Upton Sinclair's famous novel The Jungle, which is set in the Lithuanian environment of Chicago's meatpacking factories.
6 Blueberry God is the novel title of a local history that was published last year. See bibliography.